Finance Topics Covered
- Calculating total return for dividend paying stock
- Compound annual growth rates (CAGR)
Technical Skills Used
- python — pandas
Price appreciation and cash flows (eg. dividends, coupon payments) make up an asset’s total return for a given time period. It represents the actual realized performance of holding an asset through time.
Total return allows for a true comparison of the historical opportunity costs between two assets by factoring in all sources of return. My favorite way to illustrate the impact including or ignoring total return in one’s analysis is using a dividend juggernaut like Altria Group (ticker: MO).

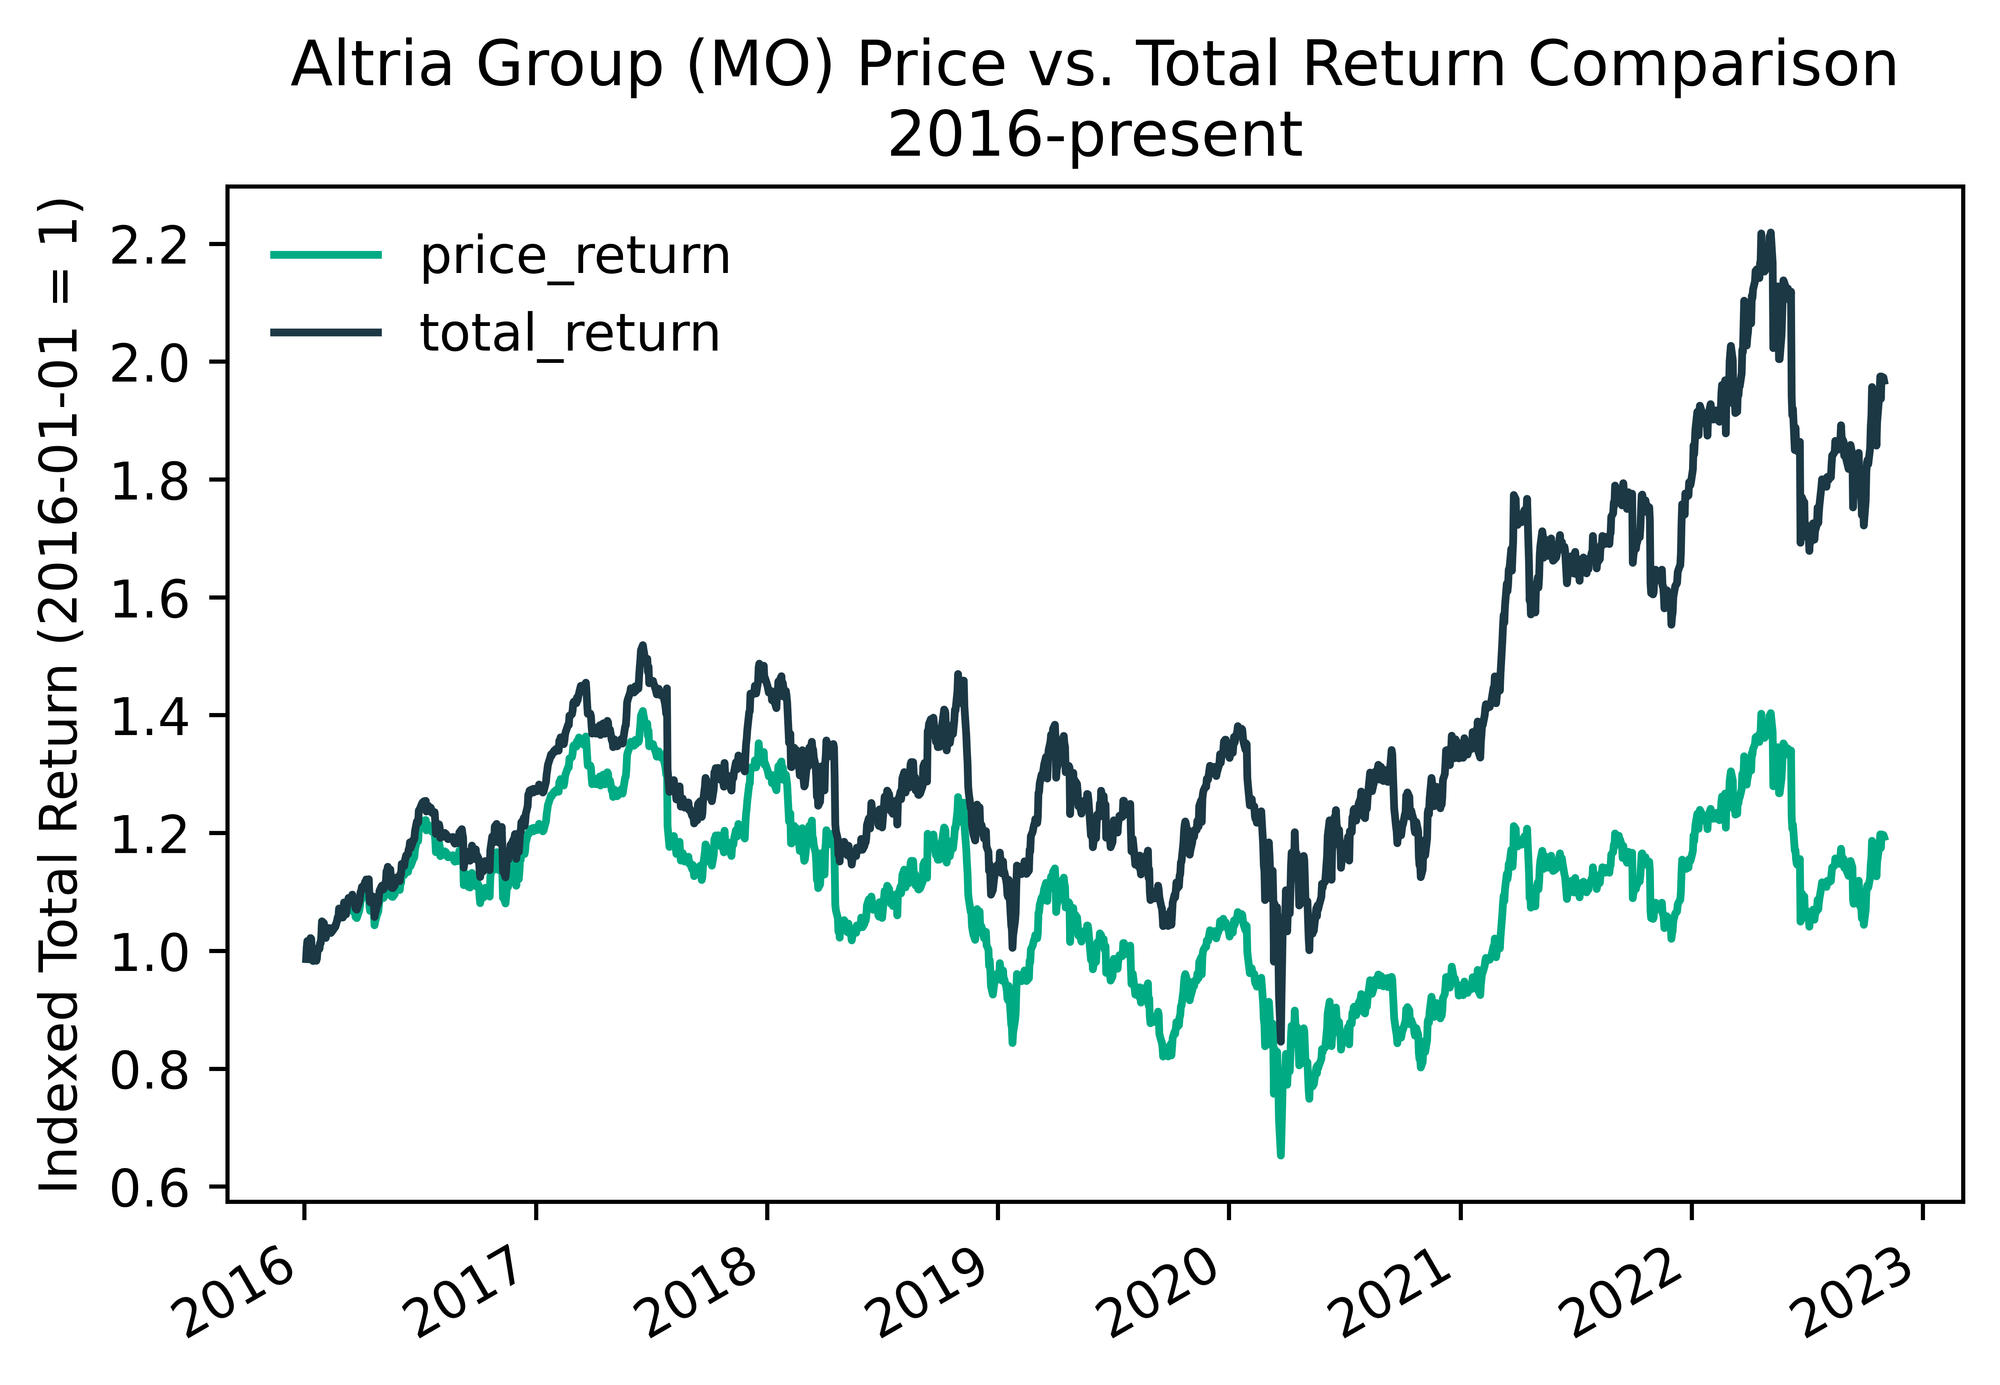
If you only look at price return (green line), this stock looks like it’s been dead money for the last 4+ years. That tells a wildly different story than the dark blue total return line — the actual lived experience of MO shareholders, where roughly three quarters of the return over that period came from the dividend (see table below).
They are probably not mad.
ㅤ | Price Appreciation | Dividend Return | Total Return |
CAGR (2016 - Present) | 2.83% | 7.82% | 10.65% |
Let’s get to the code…
Short import list today, as we can do everything we need in pandas.
import pandas as pd
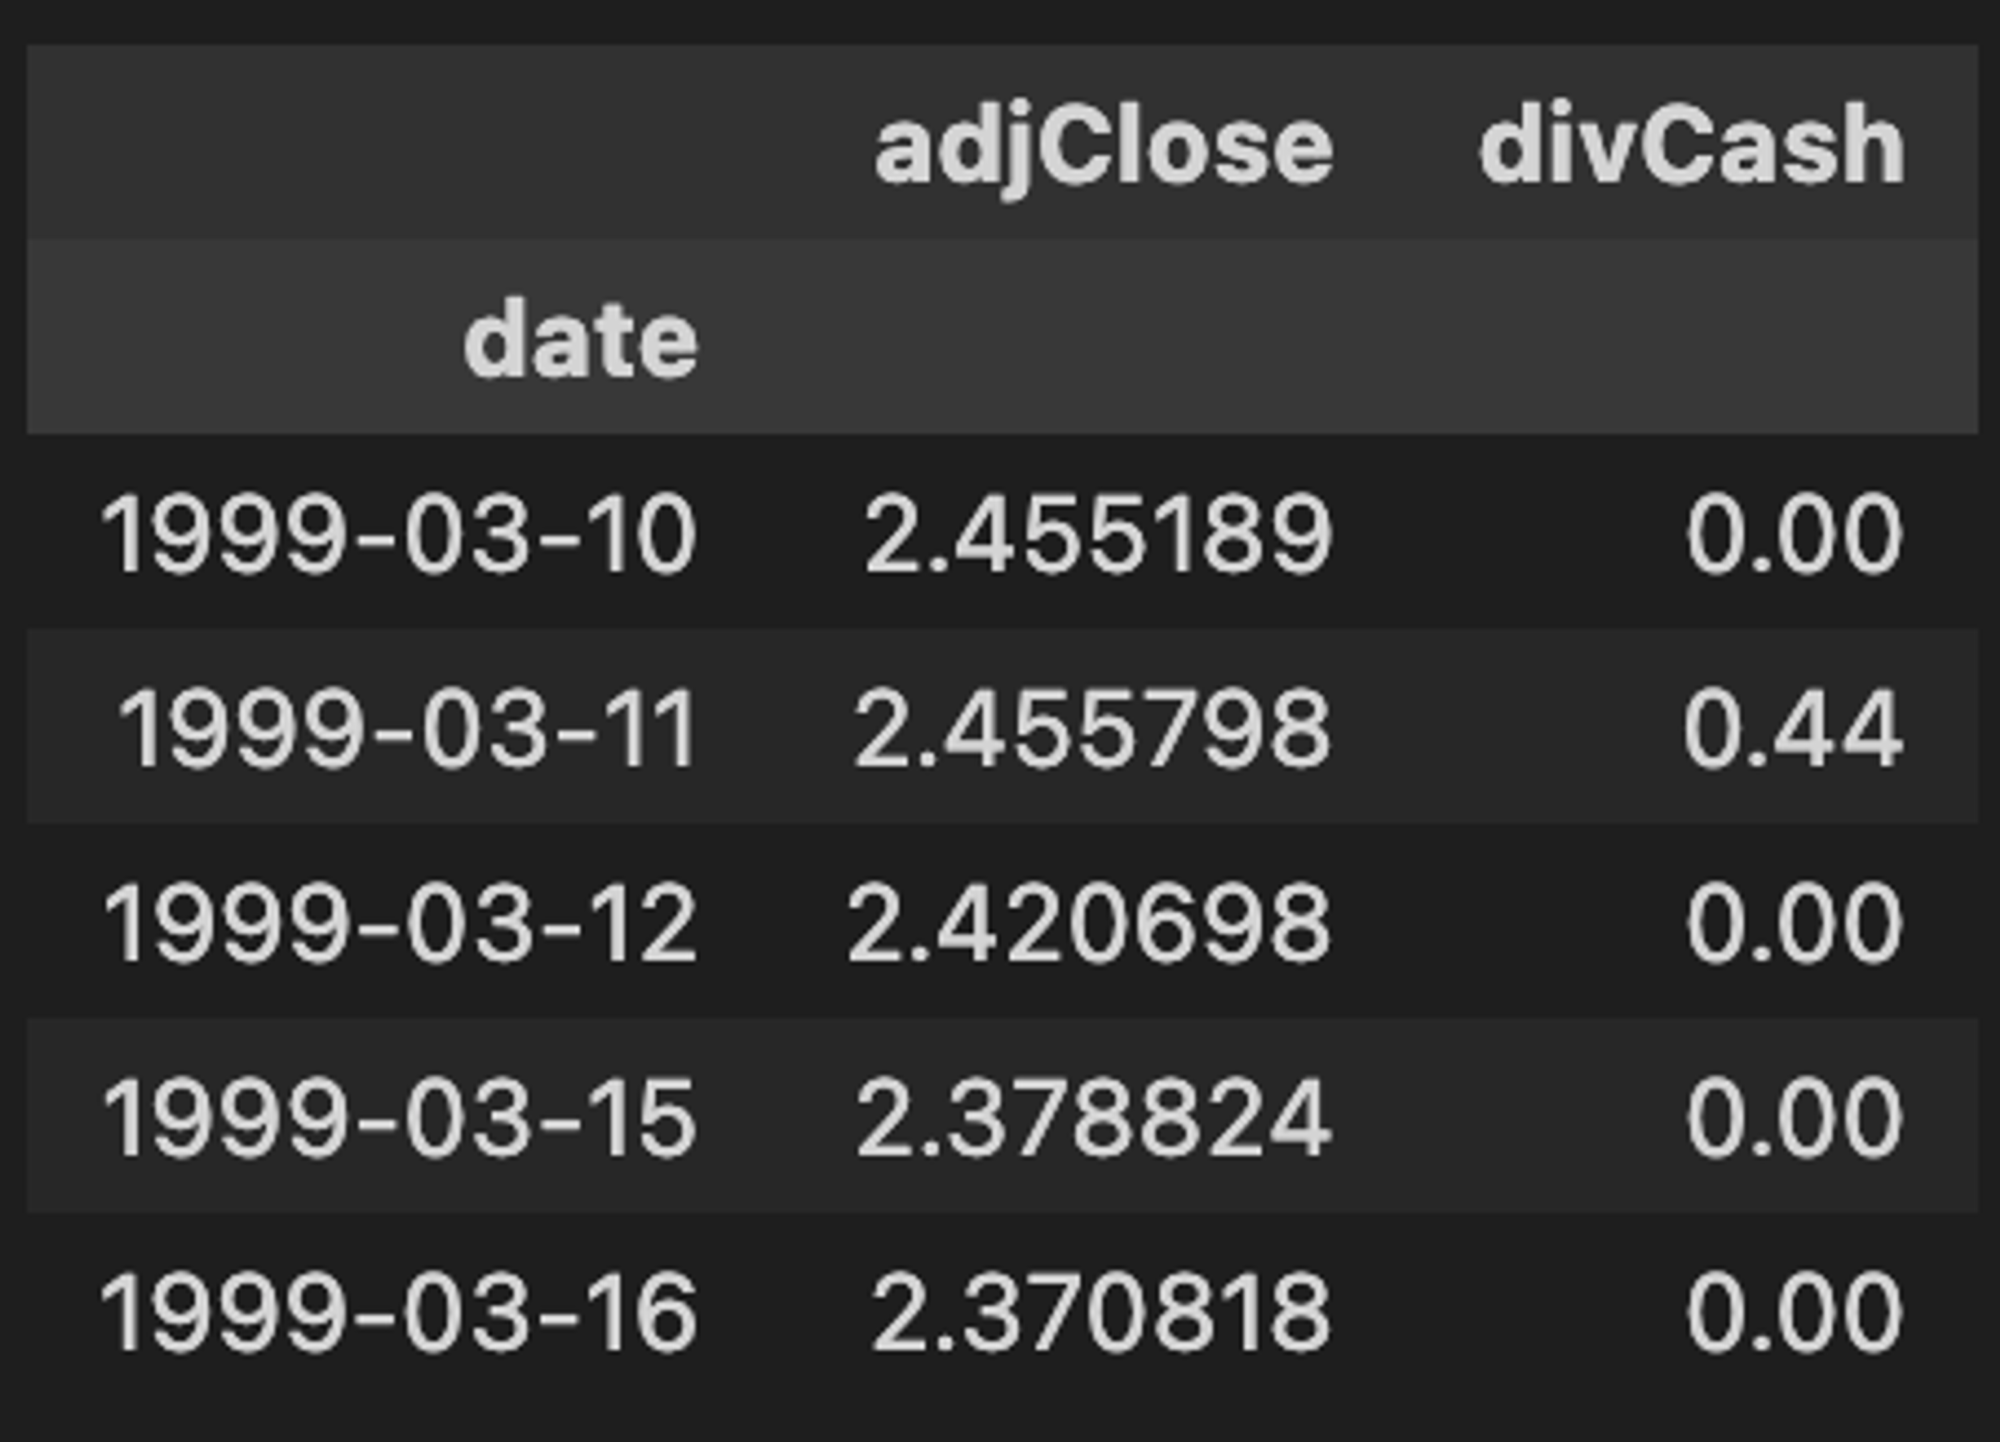
Like a Tarantino movie, we are going to start in the middle of things where we already have a pandas DataFrame with price and dividend history for a ticker.
If you’re in the market for a new financial data source, I’m digging tiingo right now. It’s super easy to work with and has the most generous free tier I’ve encountered.
Check out this post to get up to speed on a simple api call to pull historical end-of-day data, including dividend payments, from tiingo.
Our starting point will look something like this:

Next, we’ll create a total_return function that accepts three arguments:
- the dataframe with our price and dividend history
- name of the price column
- name of the dividend column
Setting the function up this way generalizes well, as it can accept a dataframe with more than price and dividend history (eg. OHLC, volume, etc.). The function adds two columns to our time series, a simple one period price return, as well as our one period total return.
The total return in a period is calculated by taking the sum of the current day’s price and any dividend payments, and dividing that by yesterday’s price.
def total_return(df, price_col, div_col):

    df['price_return'] = df[price_col].pct_change(1)
    df['total_return'] = (df[price_col] + df[div_col]) / df[price_col].shift(1) - 1

    return df
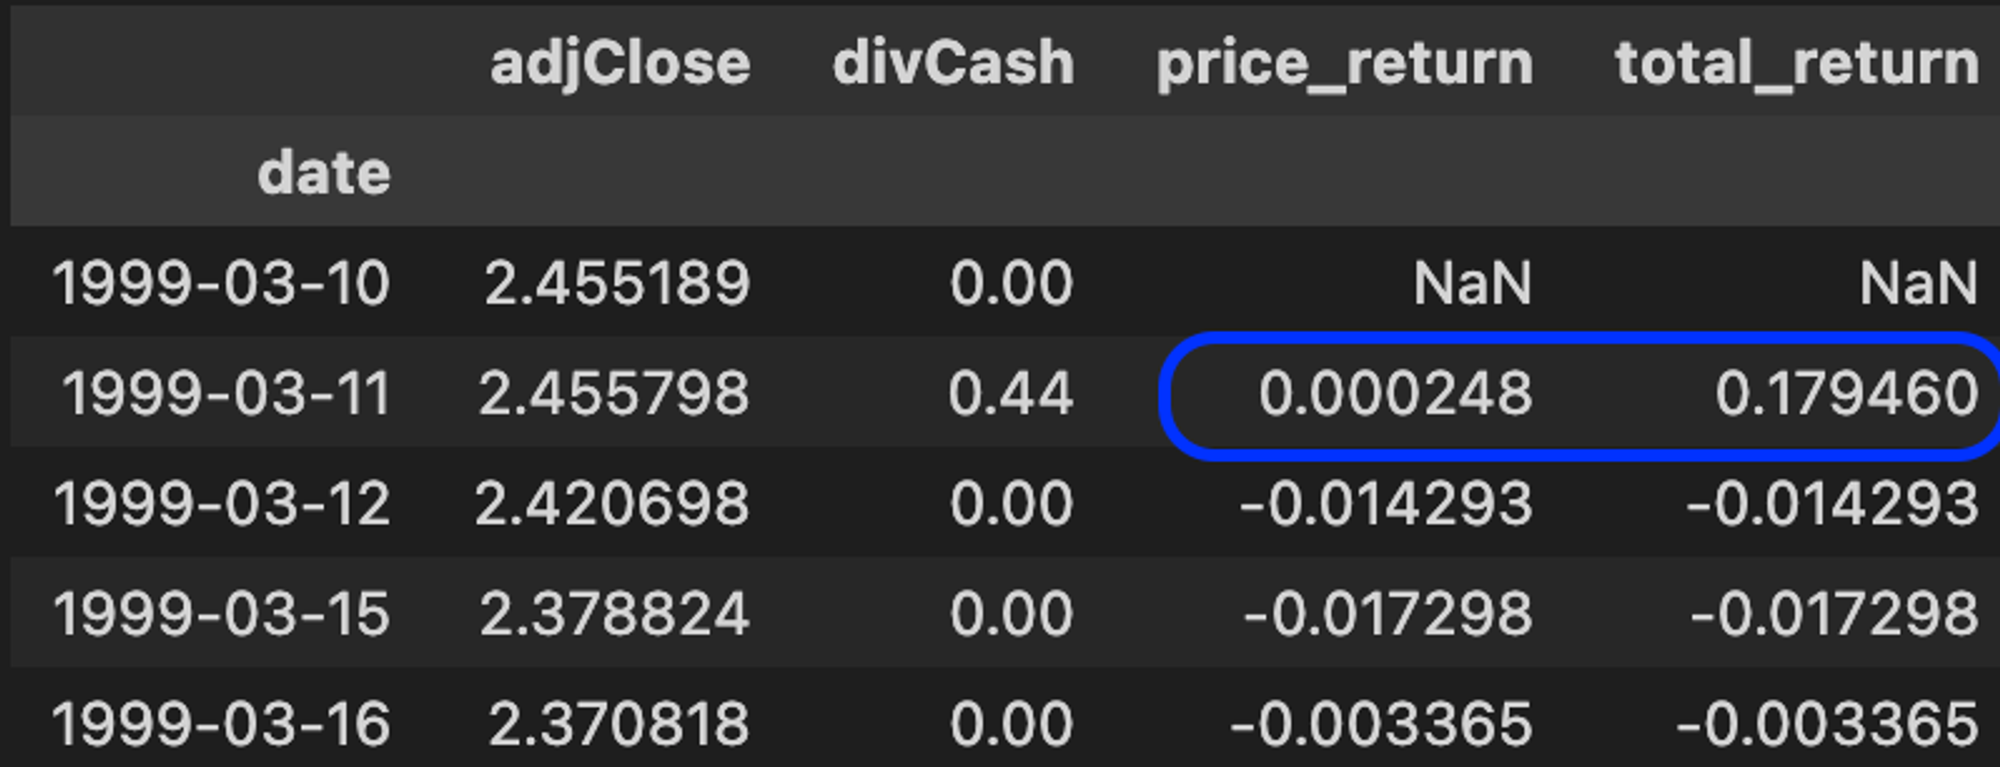
Let’s test our shiny new function:
tr = total_return(df, 'adjClose', 'divCash')

We can see how the dividend payment on March 11th impacted the return calculations. The benefit of writing it as a function is scalability. For operations and processes that are repeated often, like return calculations, accumulating those in a module or package over time will allow you to scale your work efforts… the efficiency dividends compound! (sorry, had to.)
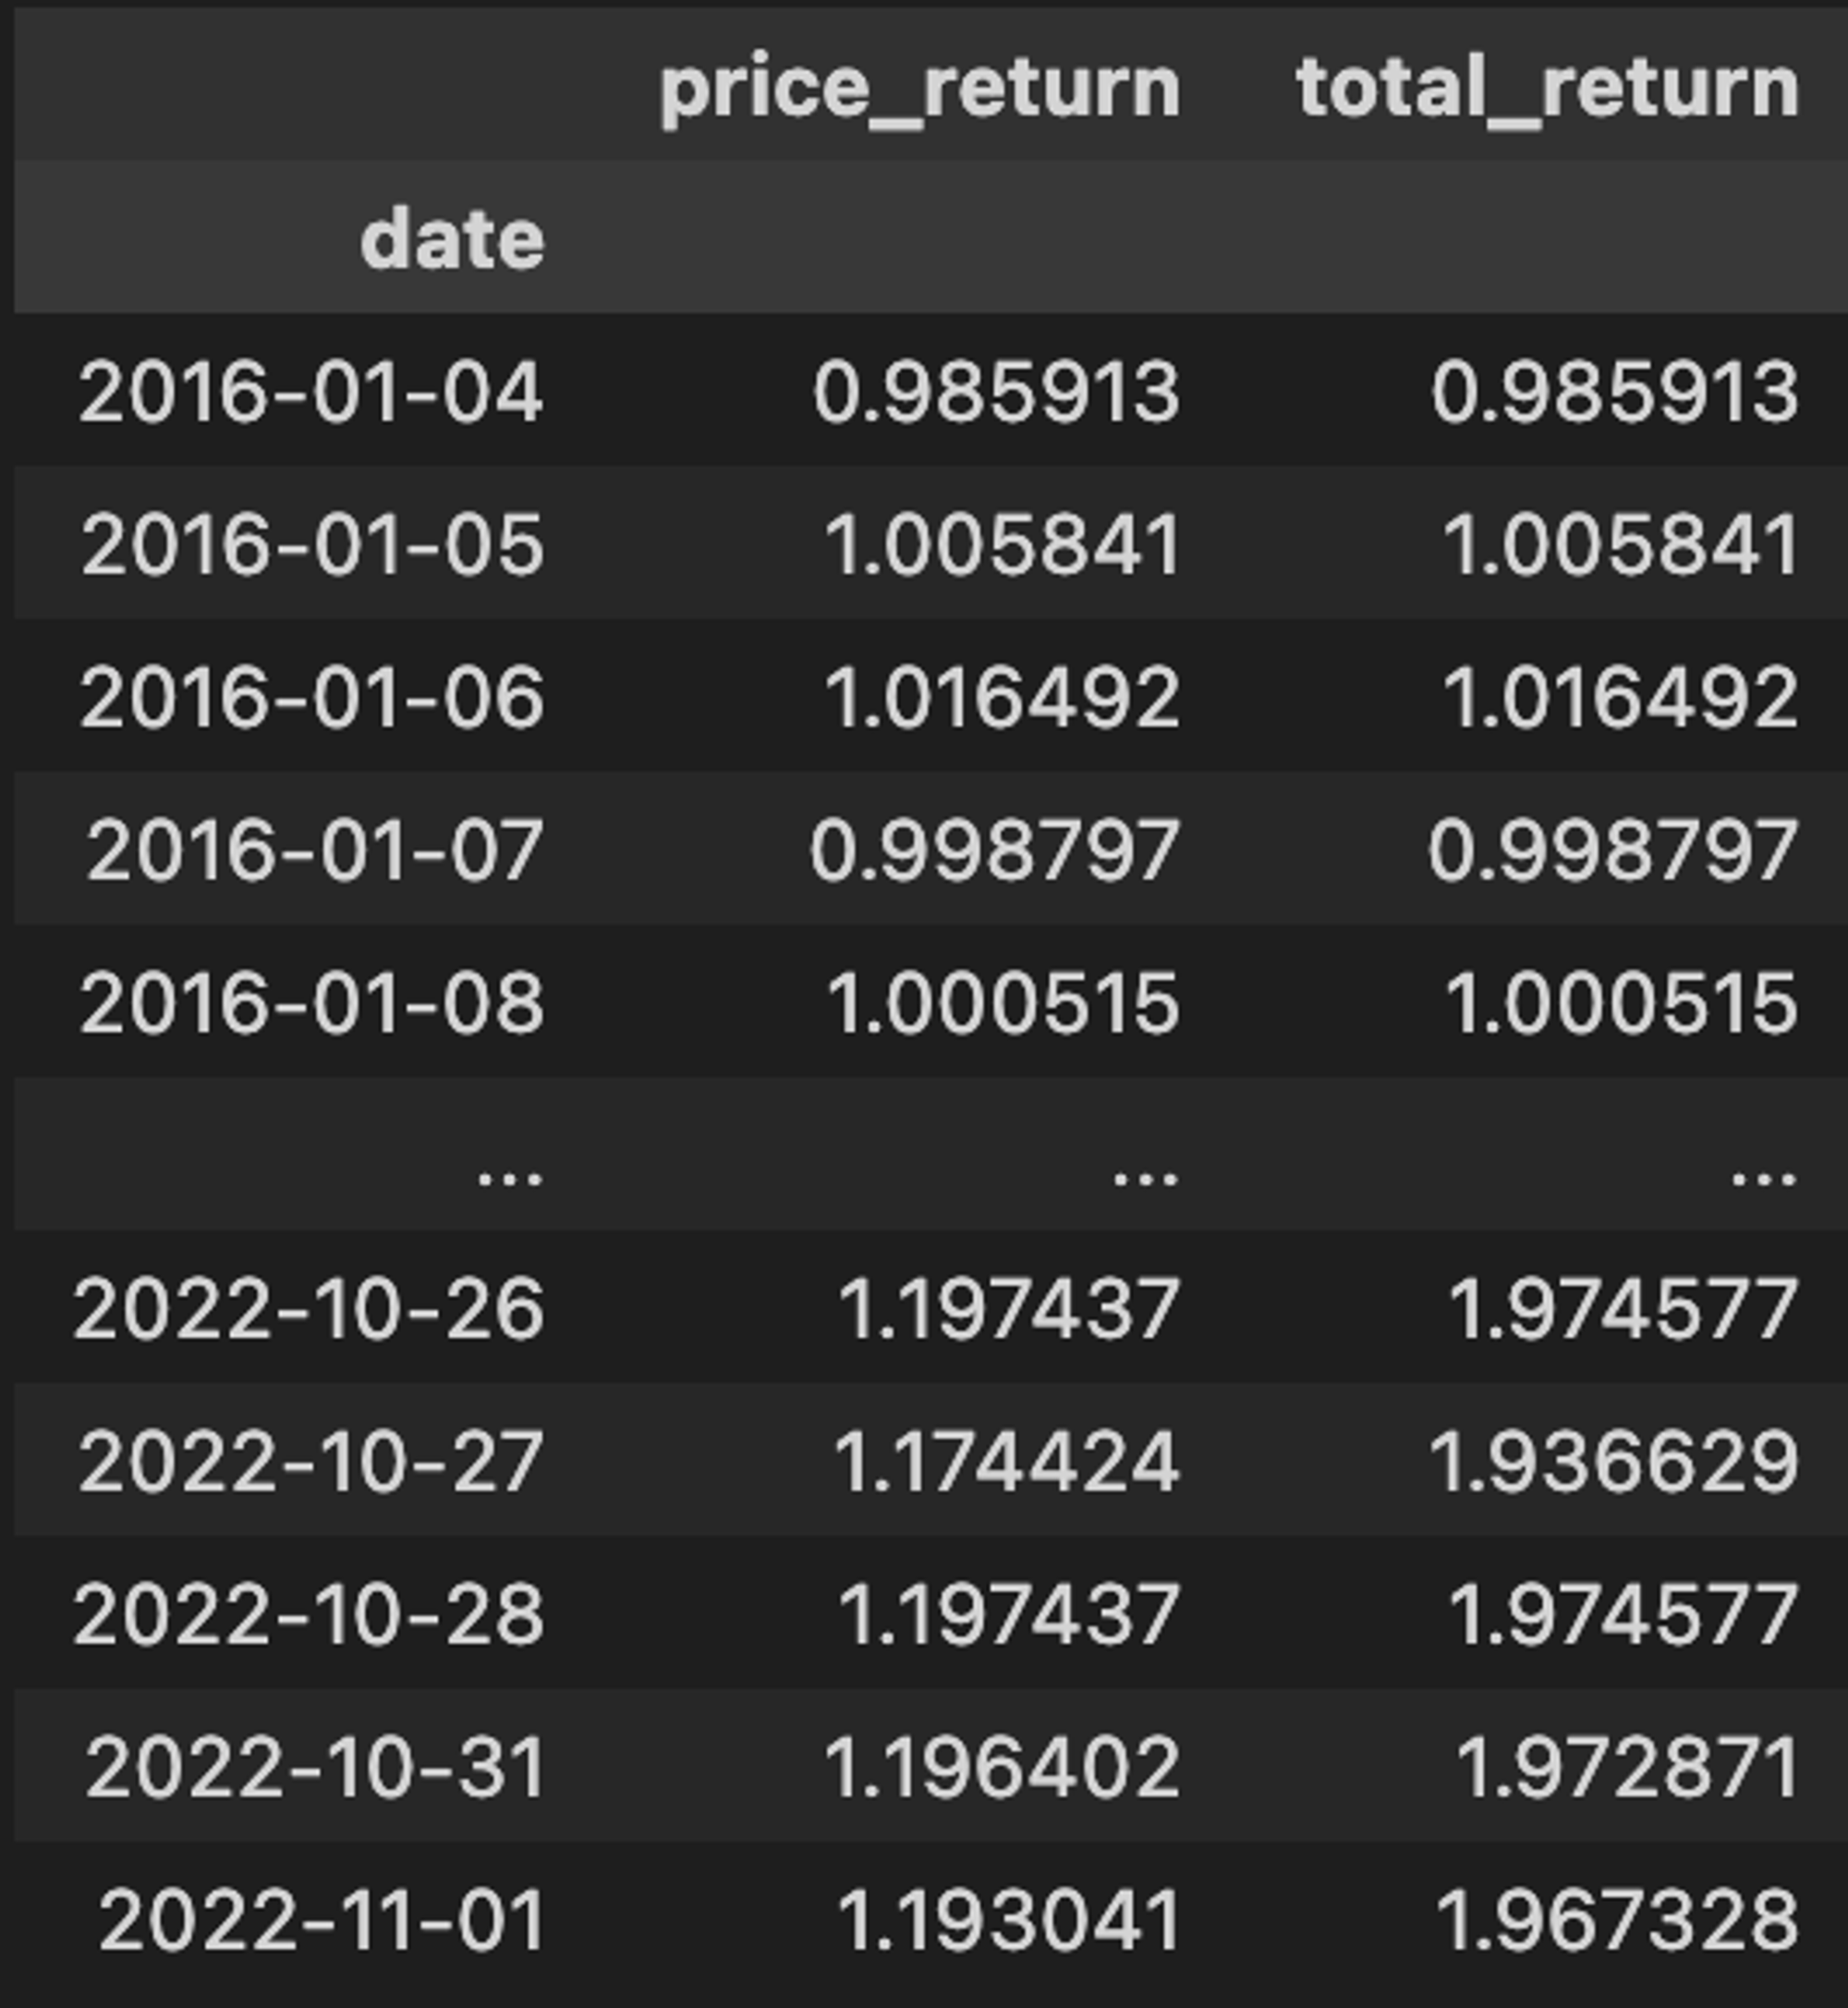
As a final piece to this exercise, let’s validate those return calculations from the table near the beginning of the post. First we’ll compound the returns, using pandas’ ability to chain methods.
comp_tr = tr.truncate(before='2016-01-01').add(1).cumprod()

To annualize,
cagr = (comp_tr.tail(1).values / comp_tr.head(1).values) ** (252/len(comp_tr)) - 1
cagr = pd.DataFrame(
    index=['annualized return (%)'],
    columns = ['price return', 'total return'],
    data=cagr
).round(2)

That’ll do it for this session. Obviously this is not the wildest project, the deepest of dives, etc. but we are just getting warmed up here. Plus, we all started somewhere, and its always good to touch on the fundies.
That said, we will dial things up a bit in the next post on this project where we’ll learn how to estimate the total return from holding fixed income securities using only a time series of bond yields. In the meantime…
happy tinkering 🤙🏼
murph
p.s. I am not active on social media. If you’d like to be notified of new tutorials when they drop, consider hopping on my mailing list.